1087 Jamison Rd
Washington Court House, OH 43160
(800) 321-1562

This is a measure of the soil acidity or alkalinity and is sometimes called the soil “water” pH. This is because it is a measure of the pH of the soil solution, which is considered the active pH that affects plant growth. Soil pH is the foundation of essentially all soil chemistry and nutrient reaction and should be the first consideration when evaluating a soil test. The total range of the soil pH scale is from 0-14. Values below the mid-point (pH 7.0) are acidic and those above pH 7.0 are alkaline. A soil pH of 7.0 is considered to be neutral. Most plants perform best in a soil that is slightly acid to neutral (pH 6.0-7.0). Some plants like blueberries require the soil to be more acid (pH 4.5-5.5), and other, like alfalfa will tolerate a slightly alkaline soil (pH 7.0-7.5).

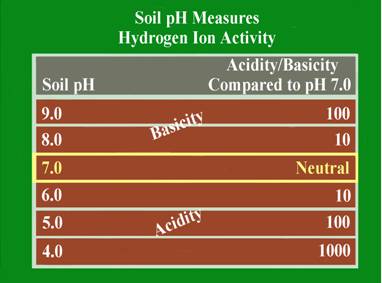
Figure 1: pH Scale Progression
The soil pH scale is logarithmic; meaning that each whole number is a factor of 10 larger or smaller than the ones next to it. For example if a soil has a pH of 7.0 and this pH is lowered to pH 6.0, the acid content of that soil is increased 10-fold. If the pH is lowered further to pH 5.0, the acid content becomes 100 times greater than at pH 7.0. The logarithmic nature of the pH scale means that small changes in a soil pH can have large effects on nutrient availability and plant growth.
This is a value that is generated in the laboratory, it is not an existing feature of the soil. Laboratories perform this test in order to develop lime recommendations, and it actually has no other practical value.
In basic terms, the BpH is the resulting sample pH after the laboratory has added a liming material. In this test, the laboratory adds a chemical mixture called a buffering solution. This solution functions like extremely fast-acting lime. Each soil sample receives the same amount of buffering solution; therefore the resulting pH is different for each sample. Too determine a lime recommendation, the laboratory looks at the difference between the original soil pH and the ending pH after the buffering solution has reacted with the soil. If the difference between the two pH measurements is large, it means that the soil pH is easily changed, and a low rate of lime will be sufficient. If the soil pH changes only a little after the buffering solution has reacted, it means that the soil pH is difficult to change and a larger lime addition is needed to reach the desired pH for the crop. The reasons that a soil may require differing amounts of lime to change the soil pH relates to the soil CEC and the “reserve” acidity that is contained by the soil. Soil acidity is controlled by the amount of hydrogen (H+) and the aluminum (Al+++) that is either contained in, or generated by the soil and soil components. Soils with a high CEC have a greater capacity to contain or generate these sources of acidity. Therefore, at a given soil pH, a soil with a higher CEC (thus a lower buffered pH) will normally require more lime to reach a given target pH than a soil with a lower CEC.

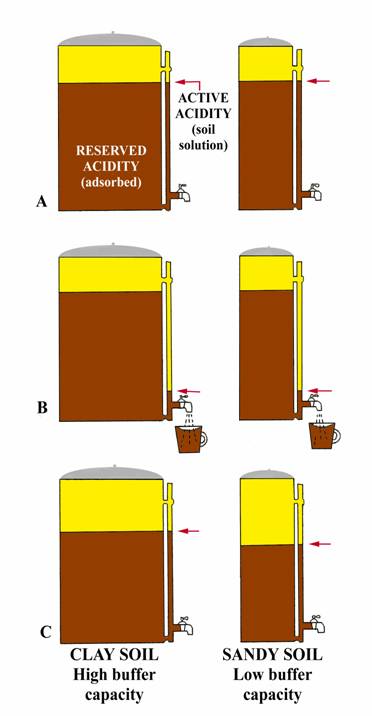
Figure 2: Coffee Pot Analogy for Buffer pH
The following analogy (adapted from University of Nebraska, Bulletin G74-153) may give a simple explanation. Consider two-coffee pots (figure 2A) one 50-cup capacity and one 10 cup, both having the same size indicator tube and spigot. Coffee in the indicator tube represents the active acidity (measured by regular pH) and that coffee in the pot represents the reserve acidity (measured by buffer pH). Let the large pot represent a clay soil high in organic matter while the small pot represents a sandy soil. Both pots have equal amounts of coffee in the indicator tube; i.e., same active hydrogen, so same soil pH.
Now open the spigot and remove one-cup of coffee from each pot (figure 2B). Removing one cup of coffee from each pot could be equated to the addition of small amount of limestone to an acid soil. Opening the spigot will cause the level of coffee in the indicator tube to drop below the level in the pot, but will return to almost the original level (clay soil) when the spigot is closed. The momentary drop of coffee in the indicator tube represents the initial increased in pH when lime is added (affects active hydrogen), but reserve hydrogen (similar to coffee in the pot) soon equalizes the effect from the lime and the pH returns to essentially its original level (clay soil, figure 2C). Thus, if the pH is 6.5 or lower, a buffer pH is run to measure the reserve acidity. The result of the buffer pH shows the amount of lime required to neuralize a major portion of the reserve acidity. The relative amounts of coffee in the two pots (figure 2C) show why a sandy soil and clay soil with the same pH result in different lime requirements. For example, the small addition of limestone (equivalent to removing one cup of coffee from each pot) reduced the total coffee (reserve acidity) by 10% in the small pot (sandy soil), but only 2% of the large pot (clay soil). In a similar manner, 1 ton of agricultural limestone will make a greater difference in the pH of a sandy soil than of a clay soil.
Soil pH has a big effect on the availability of the different nutrients that are used in crop production. The charts below illustrate the approximate availability of the different nutrients based on the soil pH of mineral and organic soils. The width of the band illustrates the approximate availability of the specific nutrient. The wider the band the more available the nutrient and the narrower the band the less available the nutrient is to crop growth.